Climate Change
For those of us keeping up with climate change related news, there are some numbers that have become familiar. For instance, we know that we should strive to limit global mean temperature to 1.5 °C.
On the other hand, while many of us feel like things are warmer than when we were little, finding this information specific to a location is not that trivial. Complicating this is the fact that global warming happens unevenly so everyone's experience may differ.


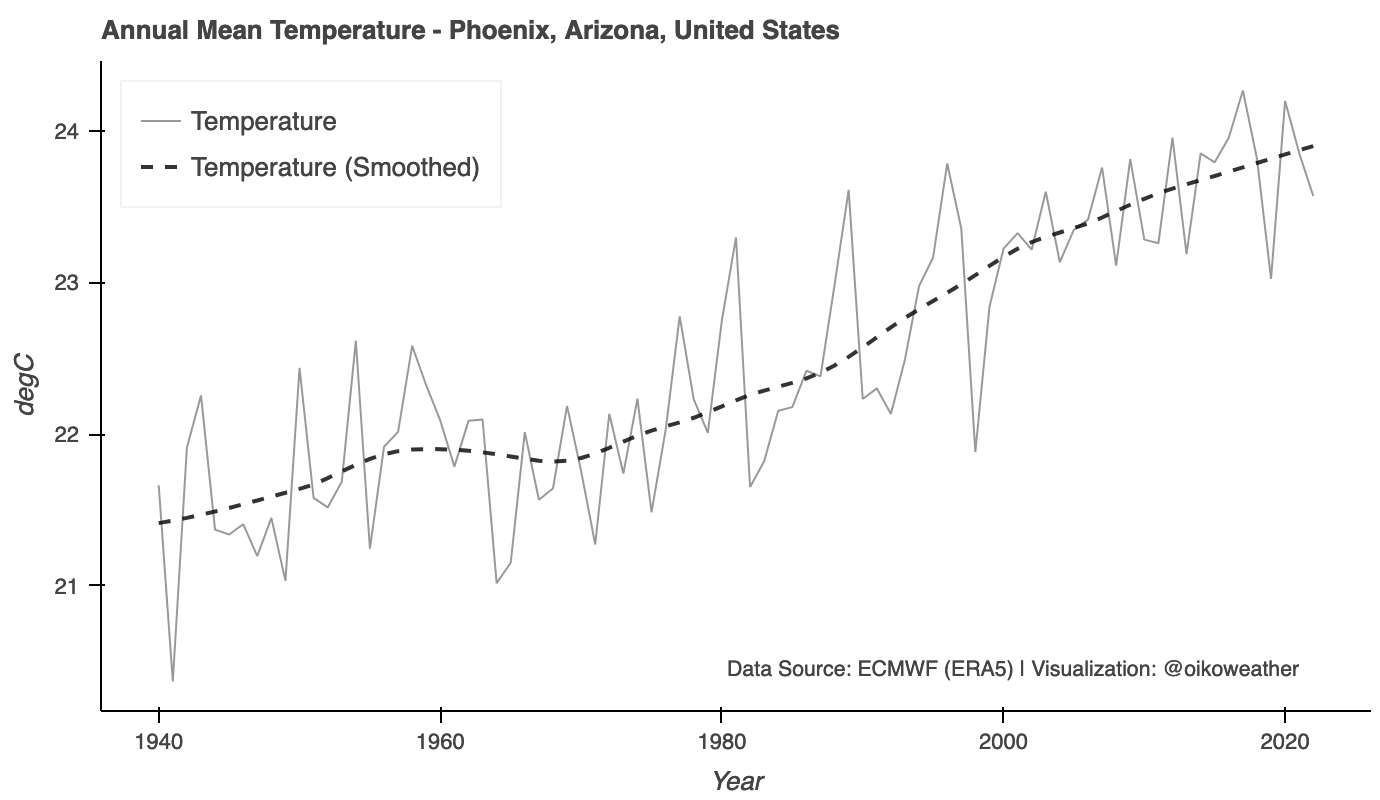
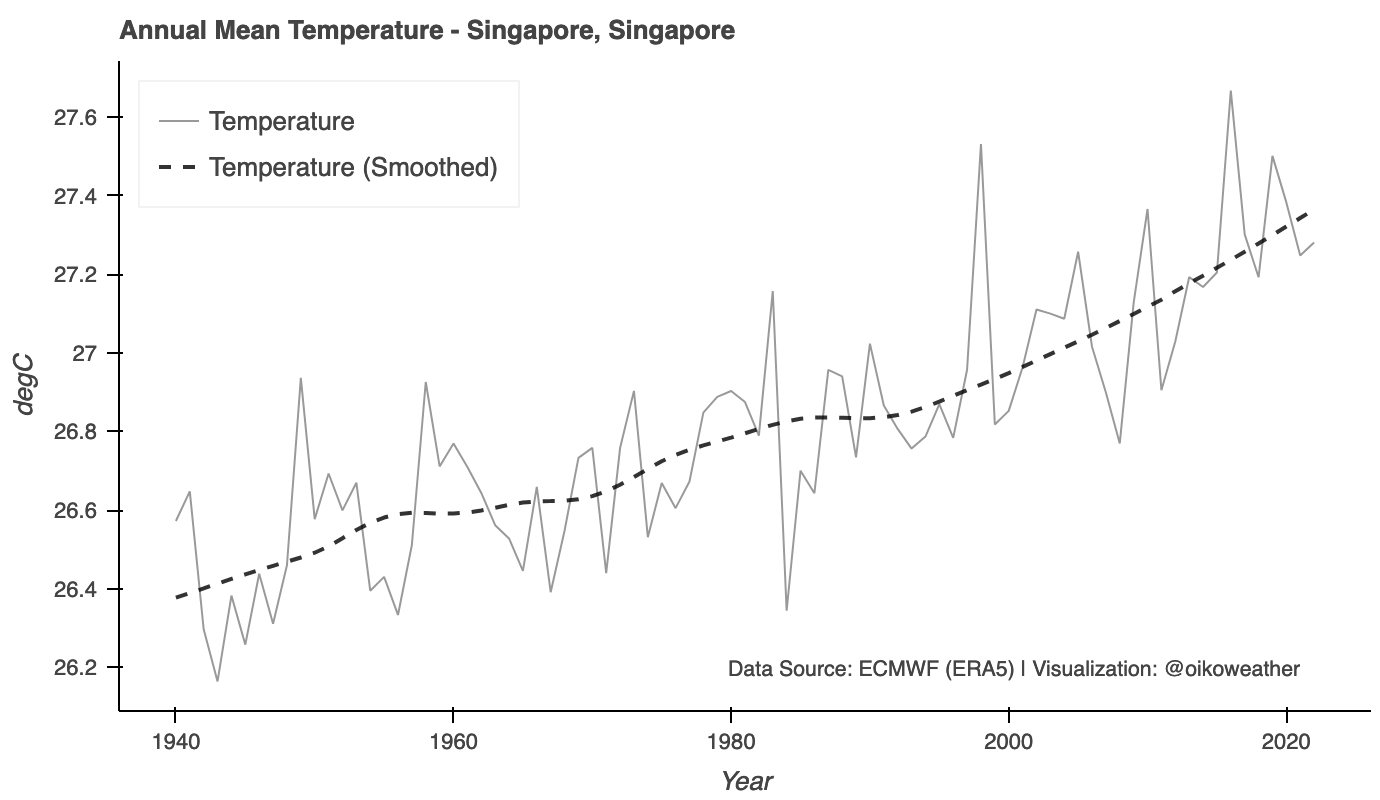
Fortunately, we have access to high-quality data published by ECMWF, where one can look up the history for any location from 1940 with ease. The dataset (ERA5) is created by combining all available sources of observation data, such as weather station and satellite, using a state-of-the-art numerical weather prediction (NWP) model to estimate the state of the atmosphere.
From the data, we can see that Singapore has experienced about 1 °C of warming since 1940. This might not seem much, but this is equivalent to an increase in cooling energy demand by almost 20%, based on the concept of Cooling Degree Days (CDD). Hong Kong, also known for its hot climate, has warmed by about 1.5 °C with CDD increase of about 40% since 1940.
Find more locations using our Climate Explorer App